Last week, I was busy migrating our staging and production Elasticsearch clusters from AWS Elasticsearch to Elastic Cloud. The reason behind this migration is because we need dynamic scripting feature in our application and Elastic Cloud is the only managed Elasticsearch hosting that currently supports dynamic scripting.
In terms of pricing, Elastic Cloud is slightly more expensive than AWS Elasticsearch. I think this is because they are using AWS EC2 under the hood. You can compare the pricing of both services here https://aws.amazon.com/elasticsearch-service/pricing/ and https://www.elastic.co/cloud/as-a-service/pricing.
As of now, Elastic Cloud supports the latest version of Elasticsearch which is 5.1.2. If you like living on the edge, I recommend you to try Elastic Cloud.
Creating a watcher
On AWS, we can use Cloud Watch to monitor our Elasticsearch cluster health status as well as monitoring other metrics such as memory and cpu usage. With Elastic Cloud, we have to use Elastic Watcher or Alerting to monitor and trigger alerts.
Currently, there is no UI to set up the watcher on Elastic Cloud. To create a watcher, you have to send a PUT request to your cluster. Please note that this blog post is based on Elasticsearch version 1.7.6 and Elasticsearch Watcher version is 1.0.1.
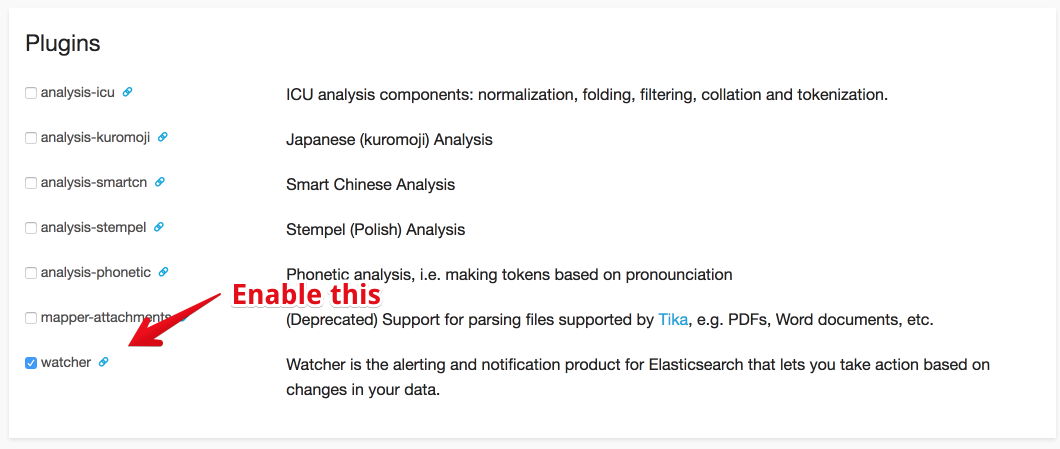
First thing you have to do is to enable the watcher plugin on the Elastic Cloud clusters configuration. See screenshot below:
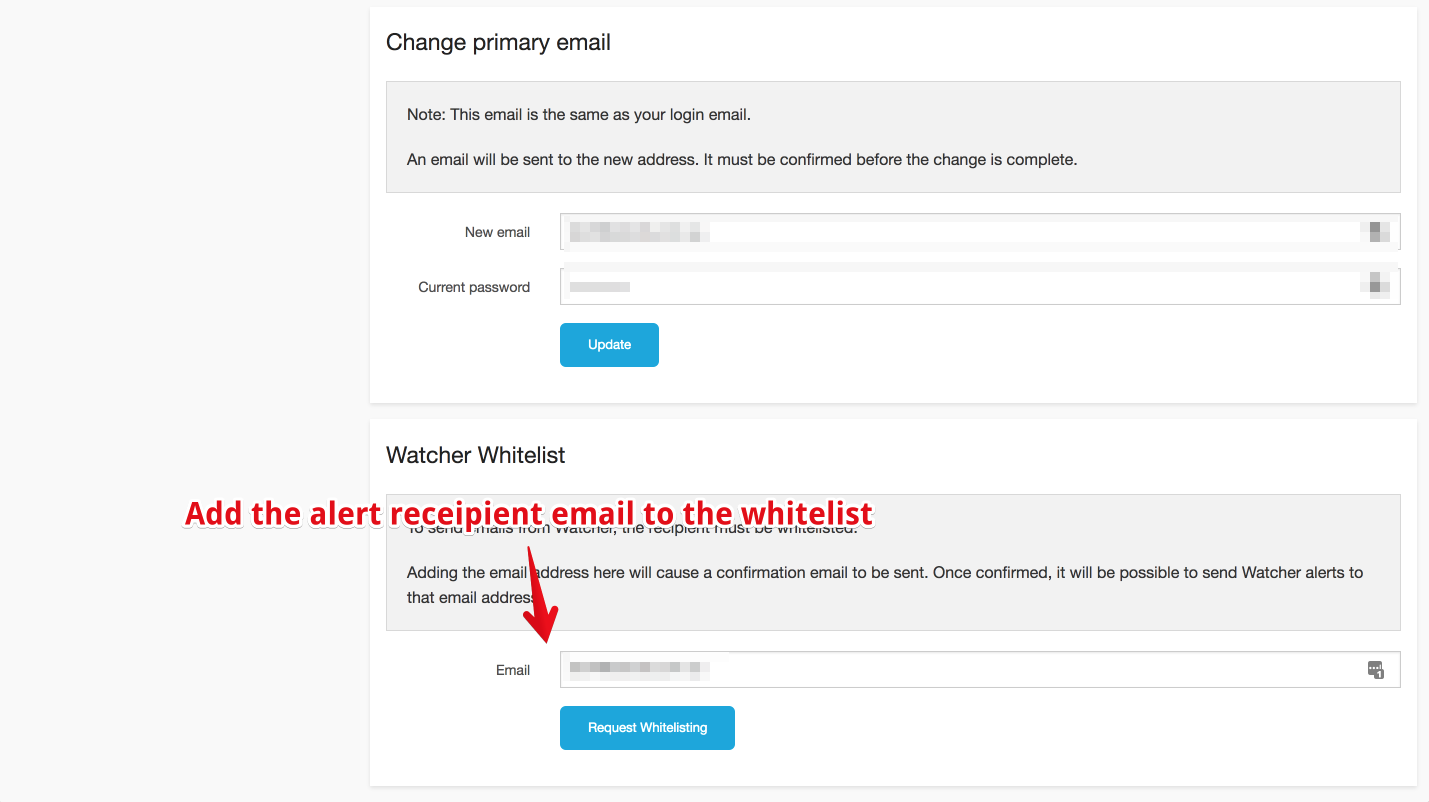
The next thing to do is to add an alert recepient email to the Elastic Cloud whitelist. In order to do this, go to Account > Email settings and scroll to the bottom of the page. See screenshot below:
Shortly after that, you will receive an email to confirm this request for whitelist. Confirm the request and you are ready to receive email from Elastic Cloud.
Now open up your REST client app or if you are one of those CLI Guru, you can stick with CURL. As I mentioned earlier, we will send a PUT request to our cluster to create a watcher.
The endpoint of the request is something like this http://elastic-cloud-username:elastic-cloud-password@elastic-cloud-cluster-host:9200/_watcher/watch/cluster_health_watch
You have to replace elastic-cloud-username, elastic-cloud-password and elastic-cloud-cluster-host with your cluster details.
And here is the JSON content of the request: ( please replace the host, auth username, auth password and to email with your cluster details )
{
  "trigger" : {
    "schedule" : { "interval" : "10s" }
  },
  "input" : {
    "http" : {
      "request" : {
       "host" : "add-your-elastic-cloud-host-here",
       "port" : 9200,
       "path" : "/_cluster/health",
       "auth" : {
          "basic" : {
            "username" : "your-elastic-cloud-username",
            "password" : "your-elastic-cloud-password"
          }
        }
      }
    }
  },
  "condition" : {
    "compare" : {
      "ctx.payload.status" : { "eq" : "red" }
    }
  },
  "actions" : {
    "send_email" : {
      "email" : {
        "to" : "the-recepient-email-address",
        "subject" : "Cluster Status Warning",
        "body" : "Cluster status is RED"
      }
    }
  }
}
In a nutshell, the request above will create a watcher that will get triggered every 10s, gets the input from our Elasticsearch /_cluster/health page, checks for cluster status ( see condition section ) and sends an email if the condition is matched.
Here is the screenshot of my PUT request using Insomnia REST Client:
After sending the request, we can confirm if the watcher is created successfully or not by visiting this endpoint on our browser http://elasticsearch-cluster-host:9200/_watcher/watch/cluster_health_watch
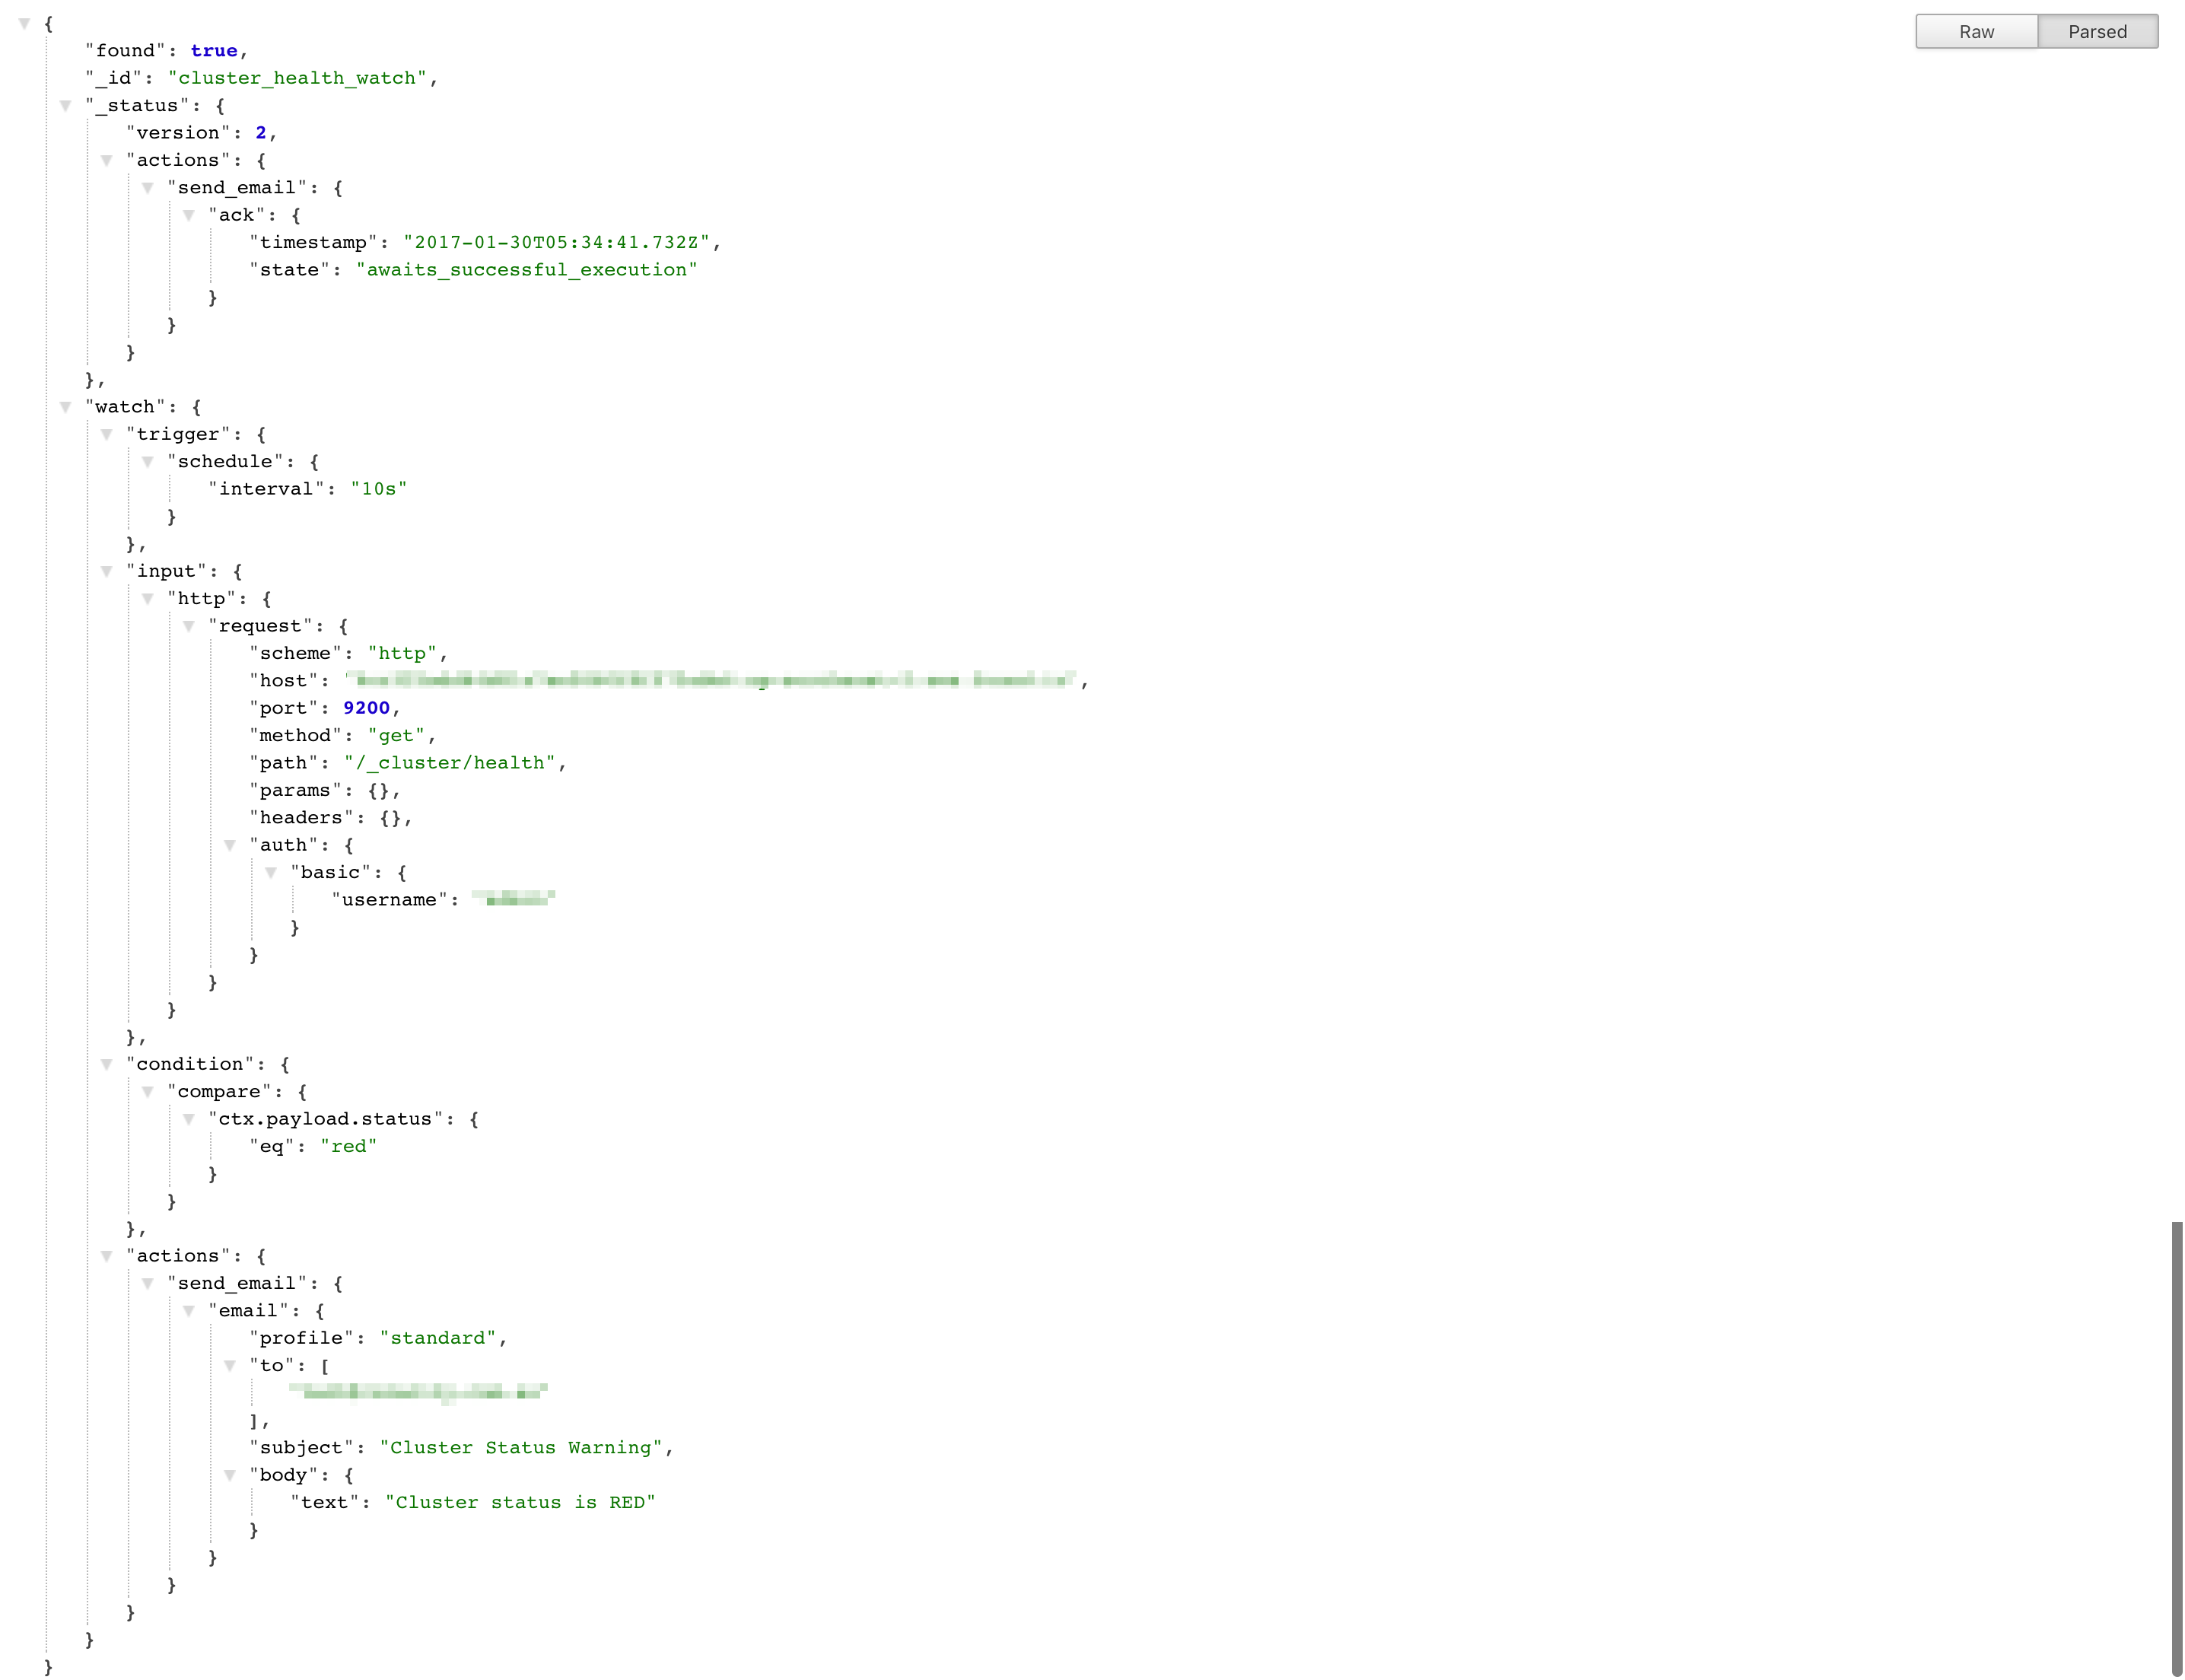
If the watcher is created successfully, you should see a response like this:
Delete the watcher
You can send a DELETE request if you want to delete the watcher
curl -XDELETE http://elasticsearch-cluster-host:9200/_watcher/watch/cluster_health_watch
Check if your watcher was triggered
You can check if your watcher has been triggered by sending a GET request to /.watch_history*/search?pretty with the following query:
{
  "query" : {
    "match" : { "result.condition.met" : true }
  }
}
If the query returns a hit, it means that your watcher has been triggered. This is helpful during debugging.
That’s it for now, the next thing I need to figure out is to create alerting for CPU and memory usage. I’ll leave it for another blog post.


